Category
Drones
Description
It is the calculation of the ratio between chlorotic or necrotic leaf area and total leaf area.
Higher index values indicate greater deterioration in vegetation cover, commonly associated with the effect of diseases. It can be used to quantify the effect of crop protection products.
Results
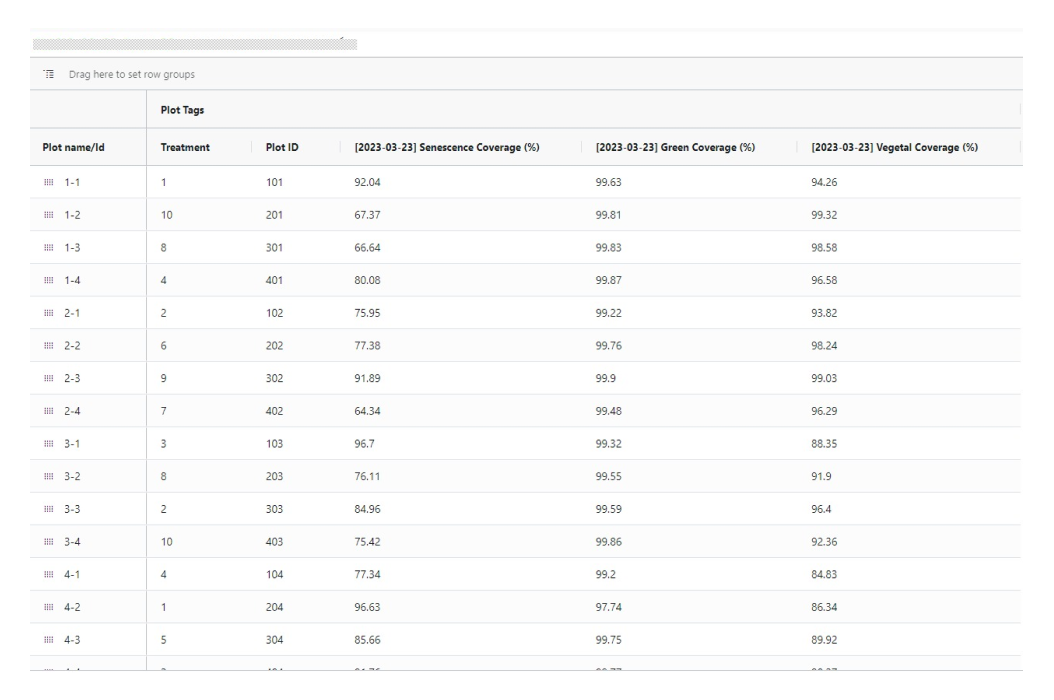
- % Green area by plot
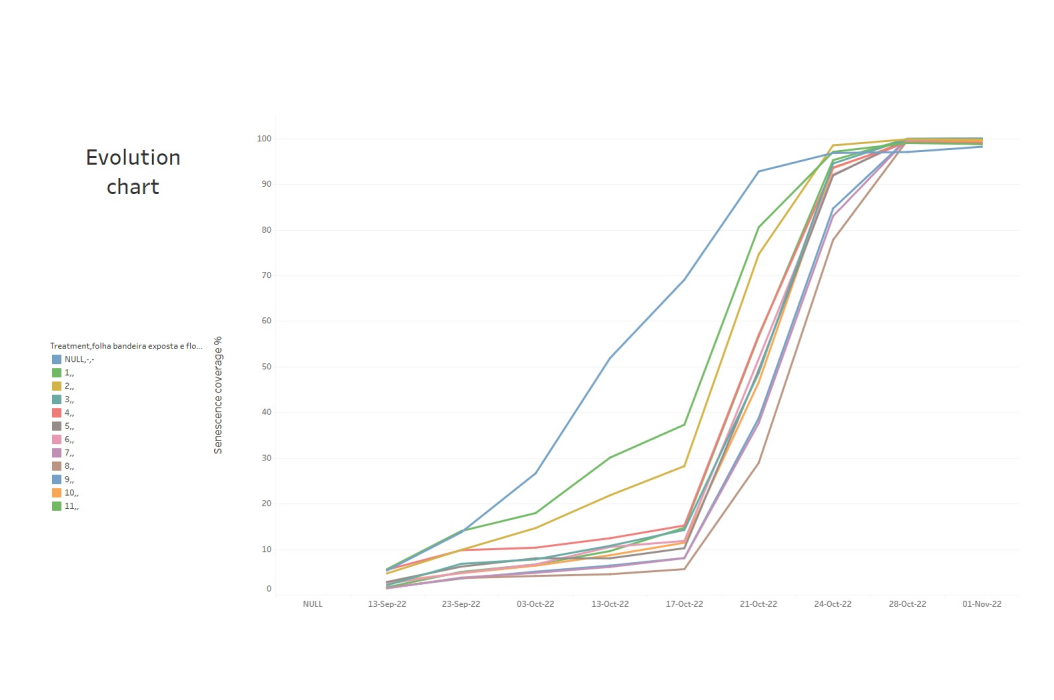
- % Senescence area by plot
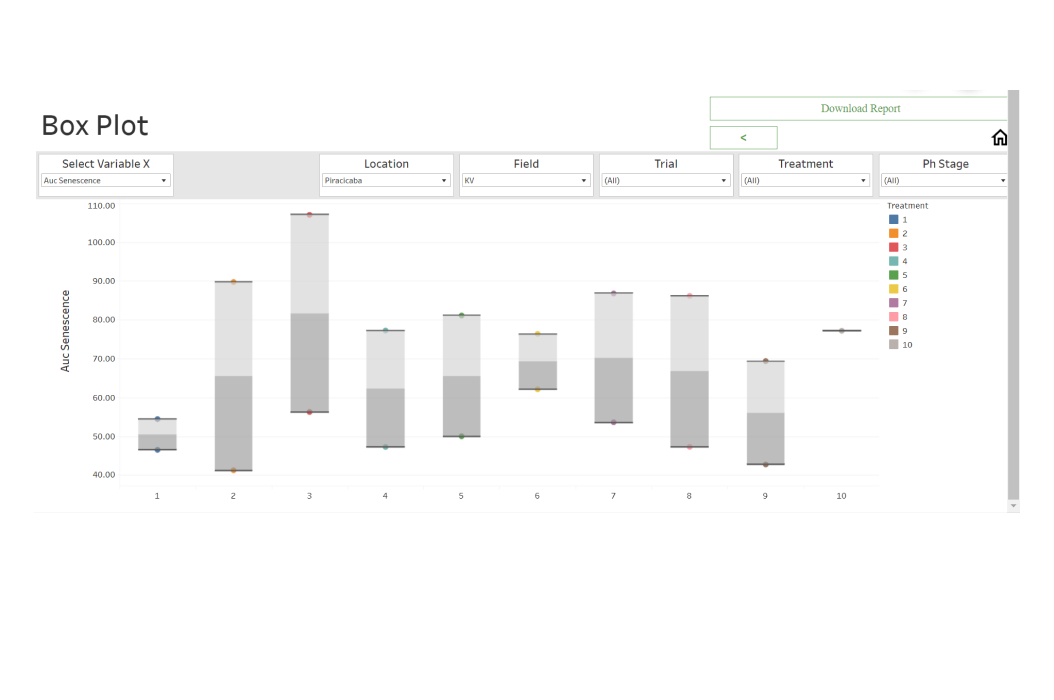
- Area under the curve
- Vegetation Coverage
Data Delivery
- Vault Data Editor
- Results API
- BI Dashboards
Flight Recommendations
Flight Moment – Phenological Stage
No specific phenological stage is required (recommended for reproductive stages)
Data Capture Requirements
Imagery Type
– RGB
Ground Sample Distance
– 1.1 – 2.2 cm/pixel (will depend on crop growth stage)